Hohli Charts is an online application that allows us to generate diagrams of different types including Cake, Bars, Venn, Radar and others.
The procedure is quite direct and as we define its variables, in a small floating window we will see, in real time, how the diagram is formed.
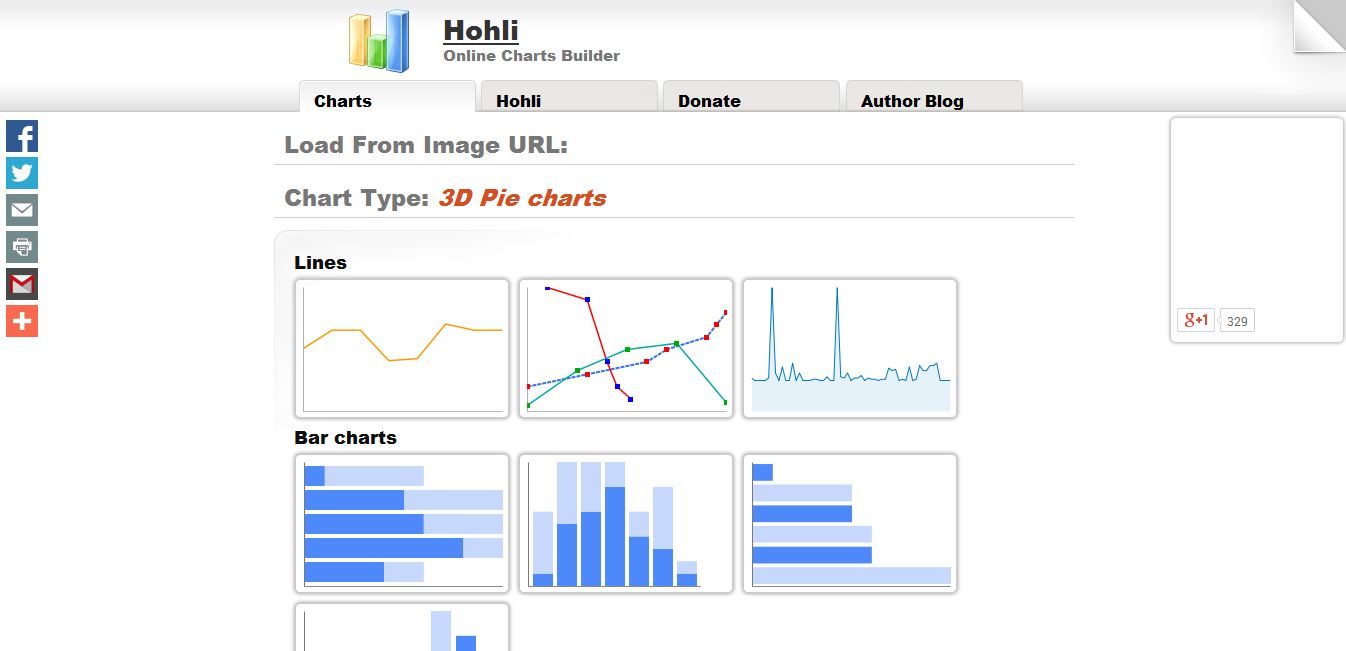
First we choose the type of diagram to draw, then its size and once this is done we begin to enter the data we want to show. The latter we must do by entering name, color and the number that represents each of the parts to show.
For example in a bar graph, you will have to define data for each bar, with its name and color.
After finishing the above, we will define the options that include the diagram title, its background colors and if it is a linear diagram, bars or Scatter Plot type, we must define the axes.
Once satisfied with our creation and confident that everything is in order, we can save the diagram in our system, copy the code to display it on our website or blog, or send the diagram link to a contact via email.
This application allows you to create very good diagrams, which we can extract from more than one hurry when we need to demonstrate something with numbers and we do not have our diagram software at hand.