If you're looking for a graphing calculator app that works smoothly and seamlessly, you've found it! Mathlab Graphing Calculator is a scientific graphing calculator integrated with algebra and is an indispensable mathematical tool for students in elementary school to those in college or graduate school, or just anyone who needs more than what a basic calculator offers. It is designed to replace bulky and costly handheld graphing calculators and works on virtually any Android phone or tablet.
Furthermore, Mathlab Graphing Calculator displays calculations as it performs them on the high-quality display of the Android device, making it easier for the user to understand the calculations and see them clearly. As one teacher noted: "I find that this app has two great strengths. First, it acts as a fine scientific calculator, but more than that, it displays the intermediate steps of the calculations as you type. It allows the students to both watch and learn how the calculations are made and how to find the final answer. Second, the graphing ability is absolutely stunning! Not only does the calculator beautifully display the graphs, but it automatically generates the x- and y- values and displays them as well.
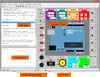
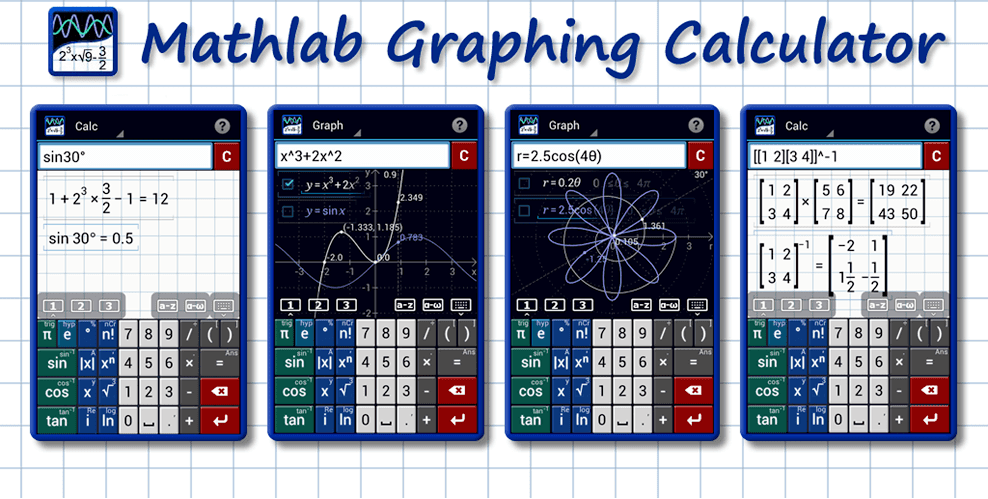
Because the calculator has so many features available to the user, this comprehensive manual is essential and will provide detailed instructions on how to use it. First, let's take a look at the four modes that the calculator offers: Calc,Graph, Table, and Library.
Calc mode uses the app as a scientific calculator to handle fractions, algebra, and matrices.
Graph mode allows you to plot graphs on both Cartesian and Polar coordinate planes. You may go to Settings to show (or hide):
The coordinates of the x- and y- intercepts.
The coordinates of the solutions to the graphs
The coordinates of the critical points (max, min).
You can trace the graph to see the function values and slopes at each point.
Table mode displays the sets of ordered pairs of the solution set to the functions being graphed. It shows the values of the independent and dependent variables depending on the solution's model equation.
Library mode allows you to save a constant, an expression, or a function that you can later load onto the workspace or use in calculations.