GEOrient is an application to plot and analyse stereographic and equal area projections, and rose diagrams of geological structural data, copied and pasted from other applications, or read from text files. Wind rose options include plotting mean wind data (wind speed/wind frequency/wind energy).
Plots and analyses stereographic projections and rose diagrams of geological structural data, copied and pasted from other applications, or read from text files with GEOrient. Wind rose options include plotting mean wind data (wind speed/wind frequency/wind energy).
 GEOrient Features:
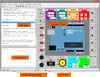
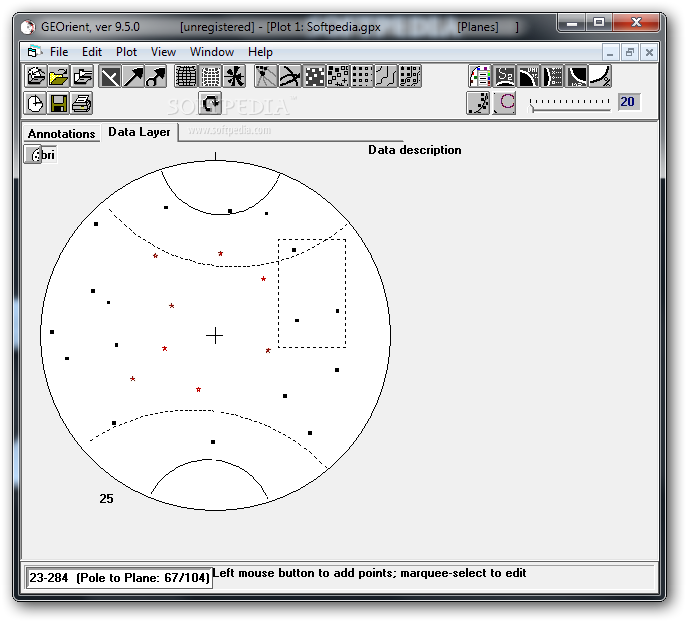
- GEOrient plots orientation diagrams (equal area, or equal angle stereographic projections, and rose diagrams) as shown in the composite image above (or this screenshot). Data is entered either by pasting from the clipboard from other applications, or from ASCII text files, in a wide range of file formats, and using a range of orientation conventions. The prime purpose is for the plotting of geological structural data but the plots may be applied to a variety of spatial/orientation data, including wind data.
- Data can be copied and pasted, for example, from external spreadsheets and databases. Using this system orientation data from tables displayed in a map in a GIS map databases (such as MapInfo) can be copied and pasted easily into GEOrient.
- Data can be be plotted as: point symbols; great circles; beta intersections (not recommended); contours of gridded point density; intersection lineation plots; or as rose diagrams. The primary plot data can include appended numeric or non-numeric information (such as length, weighting factors, mean wind data, , vein widths, assay values, etc) to allow either classification of the data within the plots, or for various rose diagram options (e.g. Length-Azimuth plots, Wind Energy plots, Mean Length/sector and Variance/sector plots). Corrections can be applied to frequency rose diagrams for linear data sampling bias.
- Linked fault plane and slip data can be plotted as either slip arrow plots or as kinematic axes plots.
- Data from multiple files can be merged as a single dataset, or can be overlaid as separate plots using different symbols. Multiple plot windows can be opened simultaneously and can be arranged on a page prior to printing.
- Best-fit great circles, beta axes, and vector mean and variance statistics are automatically calculated. Other girdles and small circles can be manually fitted to the data using the mouse to drag girdles into position. Data can be easily added with the mouse, or can be edited within, and between, plots using normal Cut/Copy/Paste mouse actions.
- Annotated points using any symbol or colour can be overlain on the basic plot.
- Data can be rotated in various ways, and linked data (such as sedimentary flow directions on bedding planes) can be rotated to the horizontal by rotating the associated bedding planes and fold hinges.
- Plots can be linked to MapInfo mapper windows and data selected in one will be selected in the other.
- The limit on the number of data is system memory and resources. Registered users can display up to 99 simultaneous plots (but more than 20 becomes unwieldy). Unregistered users are restricted to 3 simultaneously open plots.
- Download the compiled Help file for specific details. As part of Microsoft's security measures you now have to Unblock the .chm file in order view it. See here for details regarding use of Help in these packages.