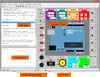
SigmaGraph is a data plotting and analysis software designed to be lightweight, reliable and easy to use. SigmaGraph runs on XP, Vista and Windows 7/8, and will be ported to GNU/Linux.
SigmaGraph offers almost all the functionality needed by scientists and engineers:
- editable datasheets (column properties, create series, set column values by using any mathematical expression, show column statistics, import/export from/to ASCII file, mask and unmask cells, printing)
- scientific graphing with a complete control of the graph (line/symbol style, colors, fonts, legends, axis properties, grid, tick, labels, scale, auto scale, log/linear scale, zoom in/out, copy format to another graph, export as image, printing, etc.)
- curve fitting (up to twenty models including linear, polynomial, exponential, Gaussian, Lorentzian, Pearson VII, logistic, power, and user-defined models)
- error bars (percentage, constant or any user defined data)
- drawing tools (line, rectangle, ellipse)
- mathematical console
- powerful scripting engine
- customizable script editor with syntax highlighting, code completion, etc
Creating a Line/Scatter Graph with SigmaGraph:
To plot the imported data:
- Click the ‘Add Curve’ button (or click the ‘Graph/Add Curve’ menu) and select the X and Y columns to be plotted. You can change the column properties (and modify the column type: X or Y…): right click and choose ‘Properties’.
- Set the line and symbol style and color.
- Click the ‘Add’ button. And close the ‘Add Curve’ dialog. You can choose the curve axes by clicking the X-Y, X-Y2, X2-Y or X2-Y2 button. You can modify all the graph properties (curve style, colors, fonts, axis, scale, etc.) in the ‘Graph Options’ dialog by clicking the ‘Graph Options’ button in the toolbar.
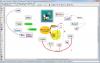
Fitting with SigmaGraph:
To analyze the curve previously created, you can use the SigmaGraph fitting functionality (in this guide, we are using the Lorentz peak function):
- Click the ‘Fit’ button and choose the Lorentzian model (or click the ‘Fitting/Lorentzian’ menu). Set the fitting number of points to 50. Click the ‘Show Fitting Report on Graph’ button (in order to print out the fitting result on the graph window).
- The model used in this guide (Lorentz peak function) has four parameters: a, b, c and d. In order to calculate quickly and precisely the best estimation of these parameters values, the fitting algorithm needs an initial guess. This can be done automatically for the Lorentzian model. Simply click the ‘Guess’ button. When done, click the ‘Fit’ button.
- Press ‘OK’ to finish. The fitting curve will be plotted and the parameters values will be printed out on the graph window. You can view the fitting datasheet by clicking the ‘View/Fit Datasheet’ menu.
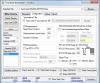
Plotting function with SigmaGraph:
To plot a mathematical function:
- Create a new document by clicking the ‘New’ button in the main toolbar. A new datasheet will be created, with two blank columns. Right click the first column (A) and choose ‘Create Series’. Set the range from 0 to 1 with 0.1 as increment.
- Right click the second column (B) and choose ‘Set Column Values’. Write the formula as shown is the figure, and press ‘Apply’ and then ‘OK’.
- To plot the function, right click the second column (B) and choose ‘Add/Remove Curve’. Press ‘Add’ and then ‘OK’.
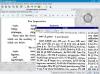
Math Console with SigmaGraph:
SigmaGraph integrates an advanced mathematical console (Menu View / Console Window). It supports the most common and useful functions. It’s easy to use: to evaluate an expression, simply write it, using operators (+ - * / ^), parenthesis and mathematical functions and press ENTER. You can set variables, using fundamental constants, etc.