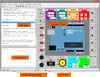
Link Windows
Visual Data is a scientific data visualization software to create 3D surface, contour plot, vector field plot, 4d scatter plots, 4d slices, 4d vector plots and isosurfaces etc.
Visual Data Features:
Regular data and irregular data visualization on Visual Data
- 3D surface plot of regular data (41*29 points here)
- 3D surface plot of irregular data (5 points here)
Creating vertex, grid and surface models in Cartesian, cylindrical and spherical coordinate systems on Visual Data
- Grid + vertex: Cylindrical surface
- 3D flat surface: Spherical surface
- 3D surface + 3D grid: 3D surface + contour map + color map
- color mapping is used: 4D surface
Creating color map, contour plot, vector field plot and 3D contour plot on Visual Data, commonly used in scientific data visualization.
- Contour map + vector plot: Color map + contour plot
- 3D surface + 3D contour map: 3D surface + 3D contour map (on 4D Cartesian surface)
- 3D surface + 3D contour map (on Cylindrical surface): 3D surface + 3D contour map (on Spherical surface)