Infographics are a combination of synthetic, explanatory and easy to understand images and texts in order to communicate information visually to facilitate its transmission. In addition to illustrations, we can further assist the reader through graphics that can be instantly understood and interpreted.
We present these 16 free programs, ideal for teachers, designers, creatives, advertisers, among many others.
We wish you like them. Share them!
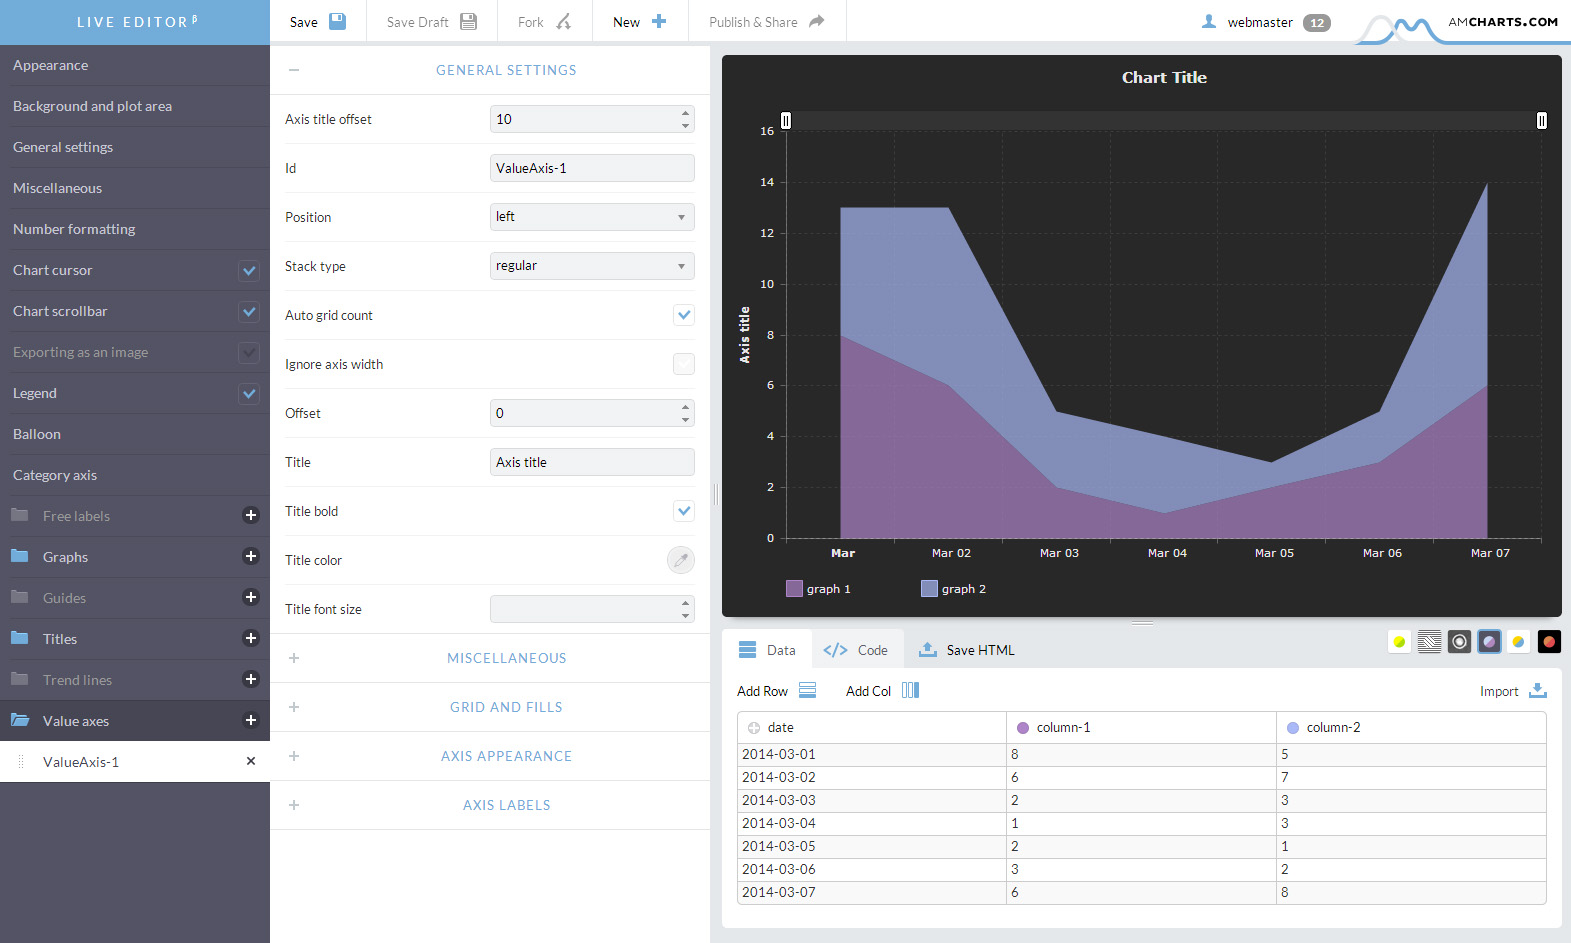
amCharts Visual Editor - Wide selection of chart types in one package
This editor allows you to use amCharts as a web service. This means that all you need to do is configure the chart and paste the generated HTML code into your HTML page.
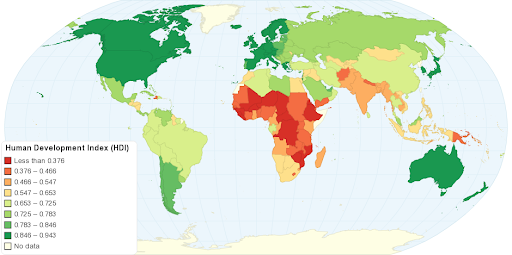
ChartsBin - Create your own interactive map
Create interactive maps online instantly! No installation required. No coding needed.
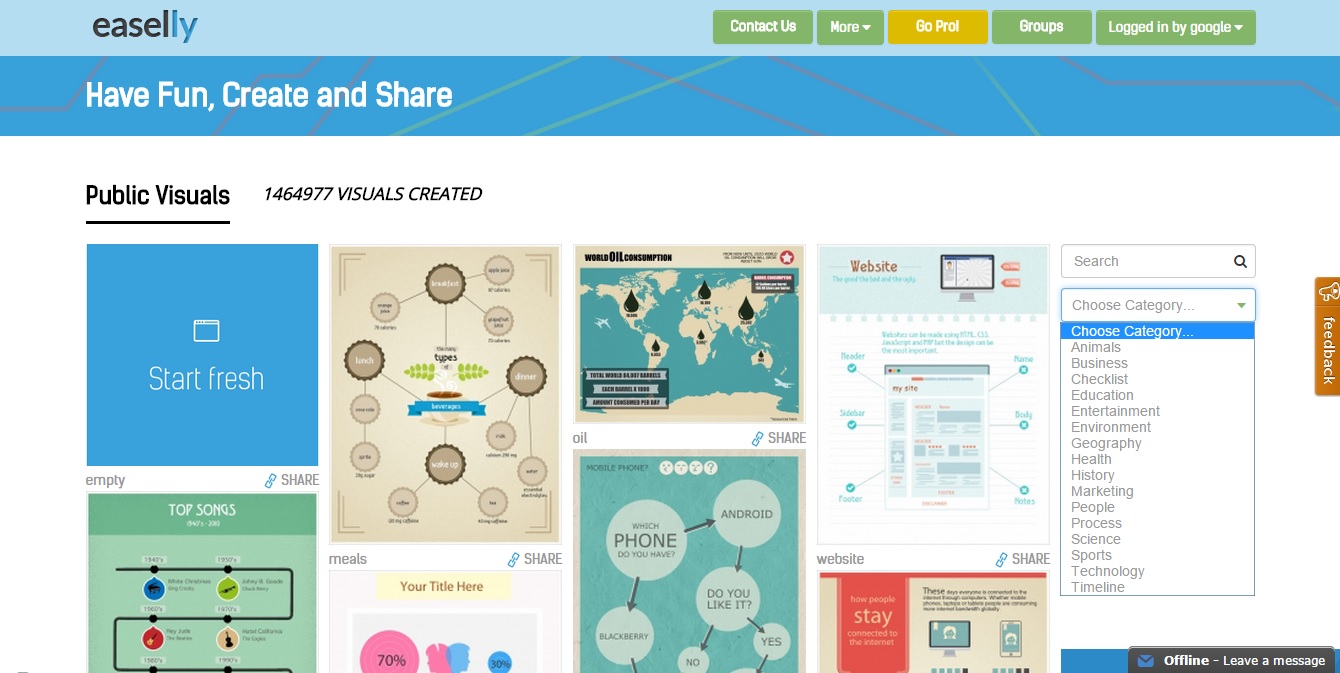
Easel.ly - Create infographics online for free
Easel.ly is a website that features thousands of free infographic templates and design objects which users can customize to create and share their visual ideas online.
Gliffy - A free web-based diagram editor
Diagrams are visual representations of ideas. They’re also the fastest, funnest, easiest way to say something. Drawn well, a single diagram does the work of thousands of words—and does it better. They've become a must-have for modern teams.

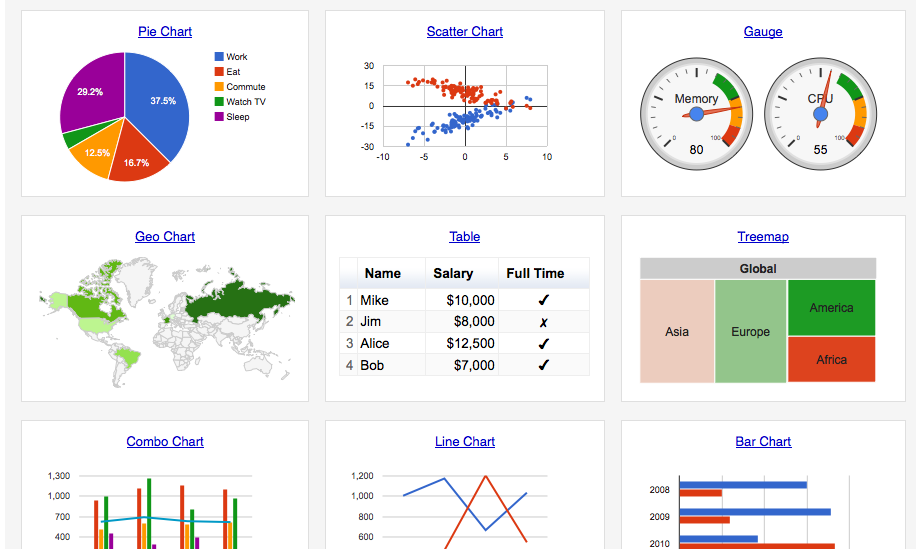
Google Chart Tools - Display live data on your site
Choose from a variety of charts. From simple scatter plots to hierarchical treemaps, find the best fit for your data.
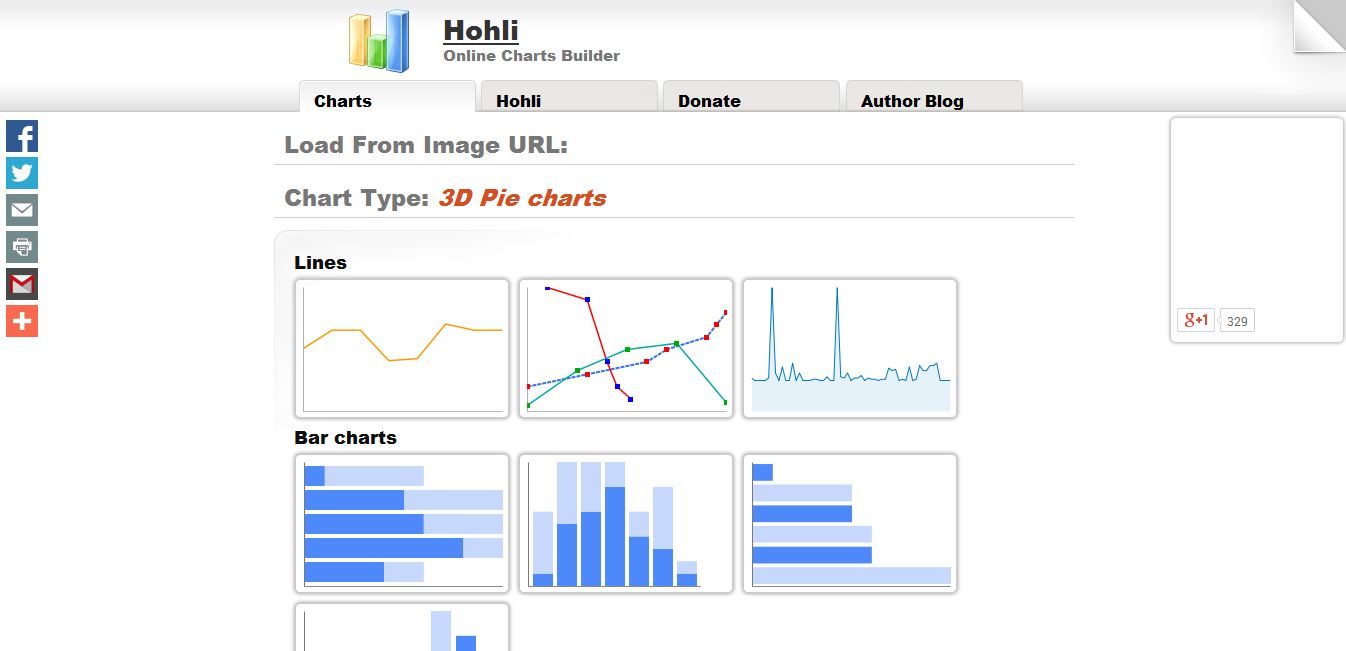
Hohli Charts - Service for work with Google Charts API. The Google Chart API lets you dynamically generate charts
Hohli Charts is an online application that allows us to generate diagrams of different types including Cake, Bars, Venn, Radar and others.
Infogram - Create infographics and interactive online charts
Start with our collection of designer templates: Never stare at a blank screen again. Our ready-to-use templates drive engagement, impress your audience, and look perfectly polished.
Lucidchart - Create flowcharts, org charts, mind maps, concept maps and many types of helpful visual communication
Lucidchart is a visual workspace that combines diagrams, data visualization, and collaboration to accelerate understanding and drive innovation. Sign up for a free trial account today!

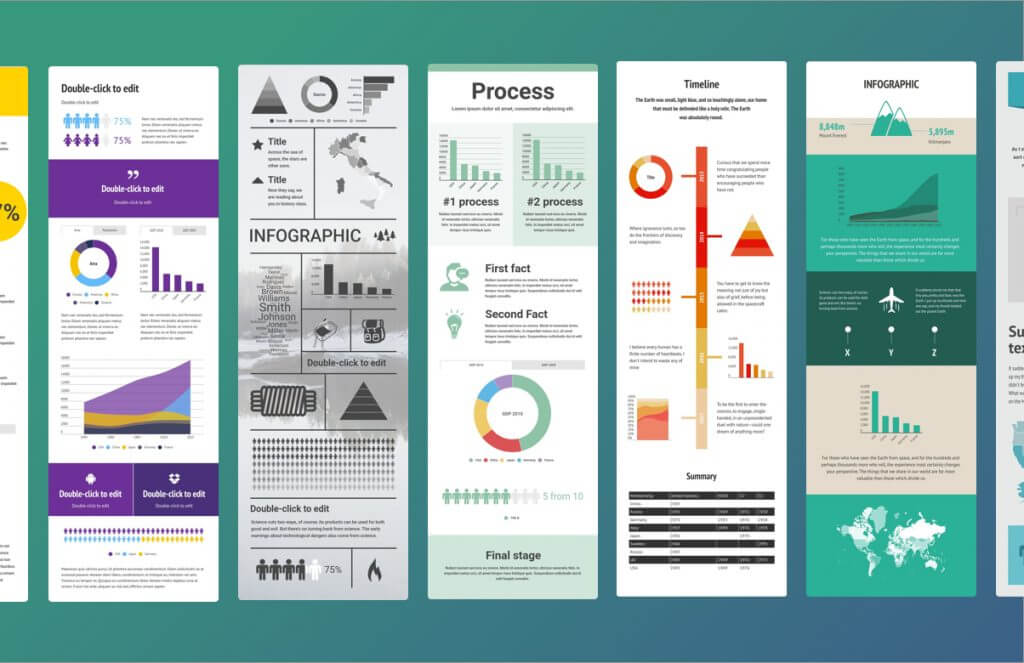
Piktochart - A web-based infographic application which allows users without intensive experience as graphic designers to easily
Piktochart is a web-based infographic application that allows users with no intensive experience as graphic designers to easily create visuals and infographics using thematic templates.
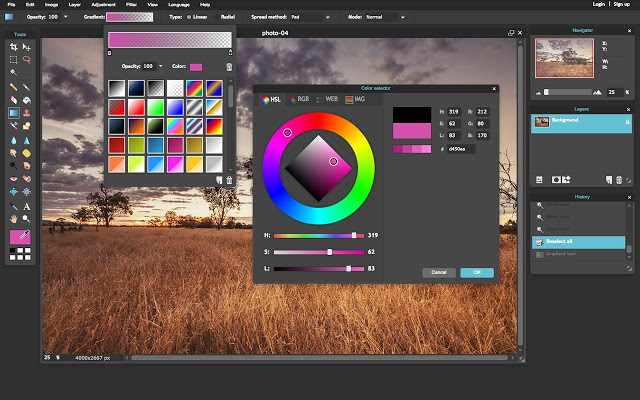
Pixrl - The most popular online photo editor in the world!
Do you prefer the classic yet advanced desktop style photo editing or is playful modern your cup of tea, either way we have the right free photo editor for you. Both editors open almost any image format like PSD (Photoshop), PXD, Jpeg, PNG (Transparent), WebP, SVG and many more. Both products are also AI powered with automatic background removal and other AI tools to help you create professional looking photo edits.
StatPlanet - Creating interactive maps which are fully customizable
Explore world stats using StatPlanet World Bank, the first prize winner of the World Bank's Apps for Development competition. The app connects with the World Bank database through its open data API, and automatically visualizes any of the 8000+ indicators, across 5 decades, for 217 countries, in 3 languages
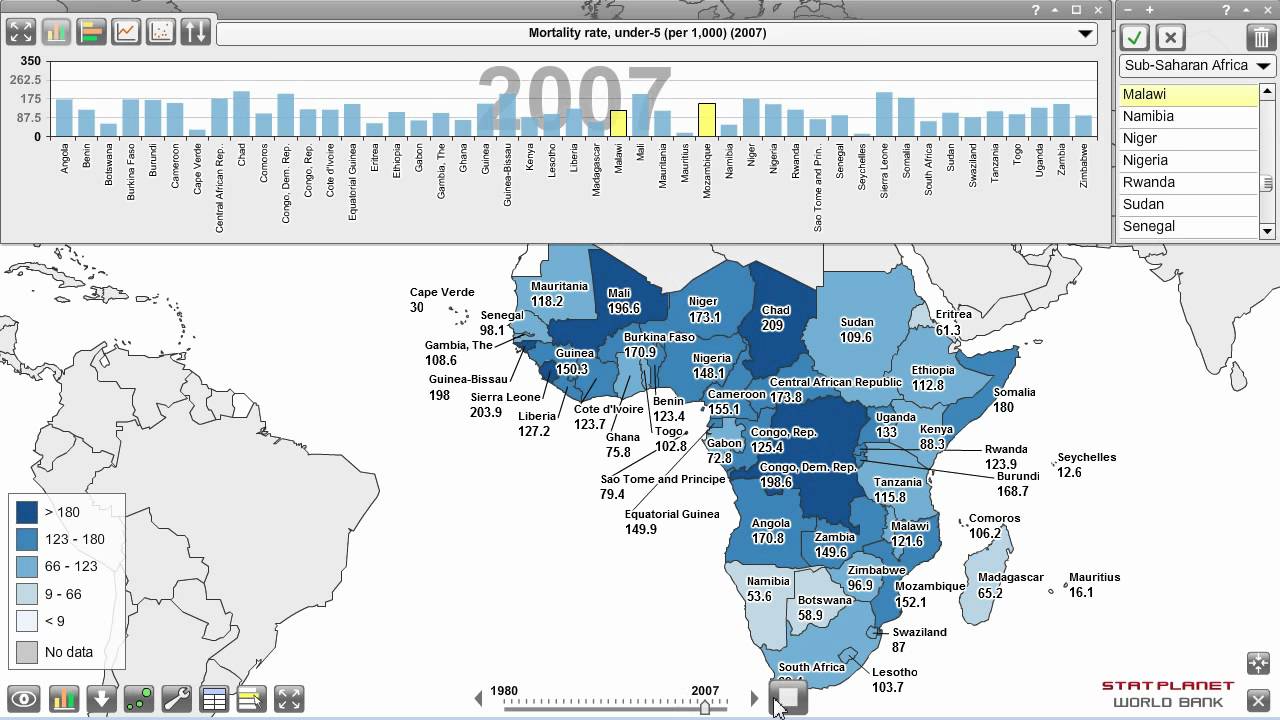
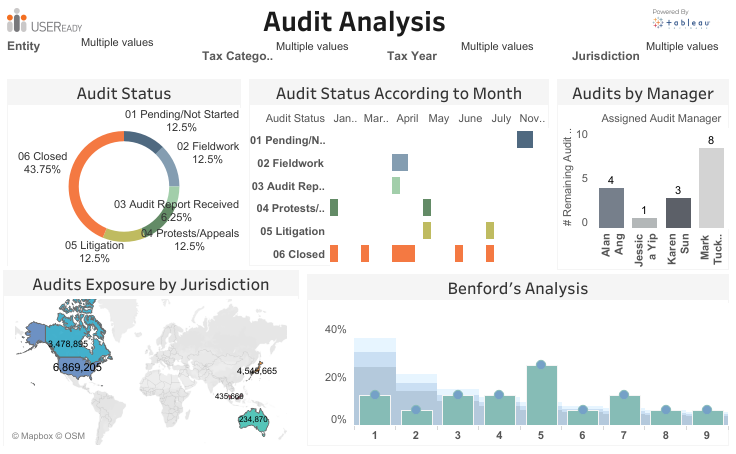
Tableau Public - A free tool that brings data to life
Tableau Public is a free data visualization software that, from simple Excel files or other data sources, allows you to generate high impact graphical and interactive visualizations.
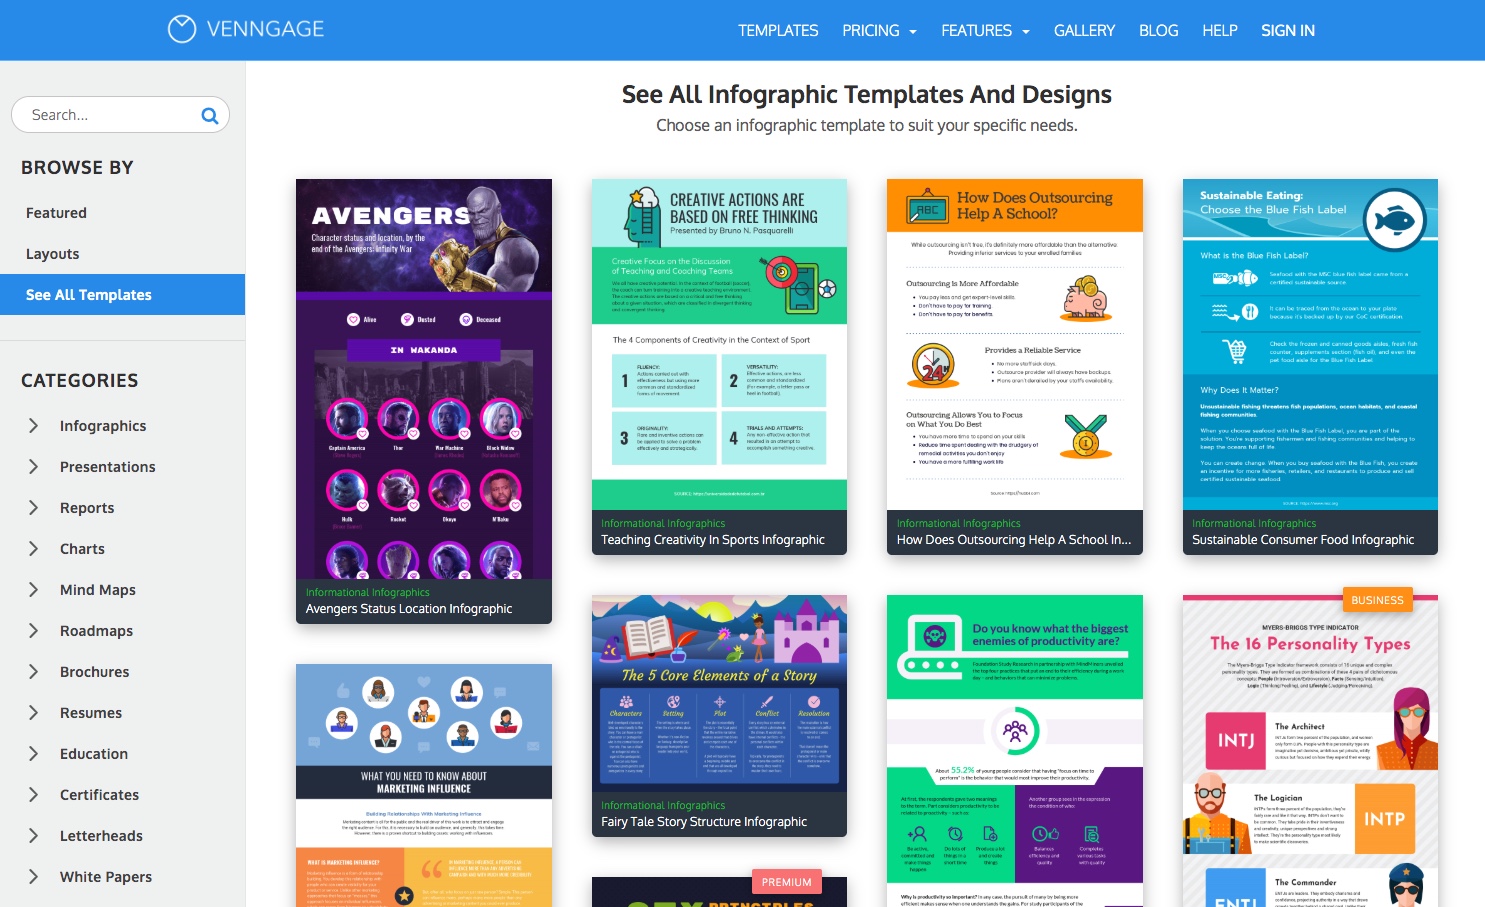
Venngage - Designed for people who work with data.
Venngage is an easy to use website where the most design-inept can create stylish content for websites, presentations, ads, social media use and much more. There are templates for a wide range of projects including infographics, reports, posters, promotions and social media images.
Visual.ly - A community platform for data visualization and infographics
Create attractive infographics, videos and e-books for your marketing campaigns. We make creating premium content fast, simple, and affordable.

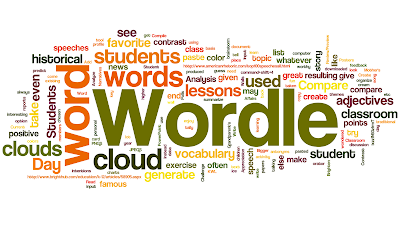
Wordle - A toy for generating “word clouds” from text that you provide
Wordle is a toy for generating “word clouds” from text that you provide. The clouds give greater prominence to words that appear more frequently in the source text. You can tweak your clouds with different fonts, layouts, and color schemes. The images you create with Wordle are yours to use however you like. You can print them out, or save them to your own desktop to use as you wish.