Venngage is an easy to use website where the most design-inept can create stylish content for websites, presentations, ads, social media use and much more. There are templates for a wide range of projects including infographics, reports, posters, promotions and social media images.
Choose the Perfect Data Visualization
Pick from hundreds of charts, maps and icons.
- Import data directly from your spreadsheets into the following chart styles
- Line Chart
- Smooth Line Chart
- Area Line Chart
- Pie Chart
- Bar Chart
- Multi-Column Bar Chart
- Stacked Bar Chart
- Scatter Plot Chart
- Bubble Chart
- Stacked Bubble Chart
- Multi-Series Chart
- Summary Stats
- Thousands of icons, pictograms and illustrations
- Upload your own images from your computer or the web
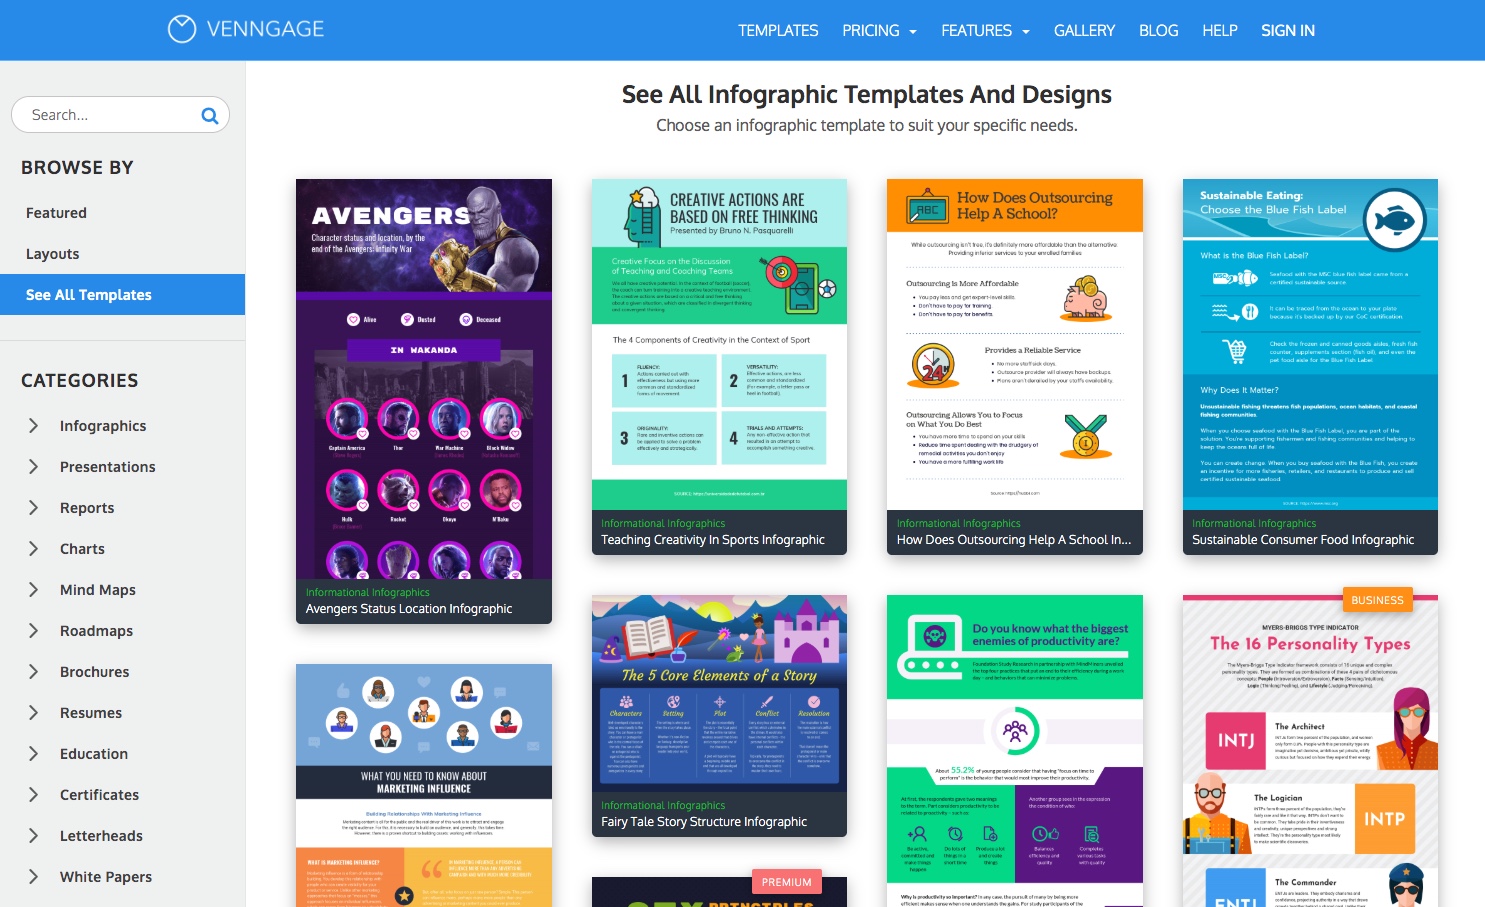
Customizable Infographic Templates and Themes
Select infographic designs to suit your specific needs
- Hundreds of beautiful templates, with new ones added weekly
- Personalizable colors, sizes, styles
- Dynamic and engaging data visualizations
Easy Drag and Drop
The easiest way to create beautiful infographics
- Pull widgets directly onto your canvas
- Lock and group widgets into place
- Adjust widget size, color, and orientation
Free-Form Design Canvas
Customize templates or create your own graphics from scratch
- Move objects around without area restriction
- Snap to grid for automatic alignment and completely free adjustment
Share Seamlessly on Social Media
Publish, embed and download are just a click away
- Privately share your infographic with anyone
- Embed and link your infographics on your blog or website
- Download your infographics as images or PDFs